
Introduction to Statistics
Make sense of data with practical foundations in averages, distributions, standard deviation, and z-scores.
Turn a collection of numbers into a clearer picture
Overview · Outcomes · Audience · Agenda · Certificate · FAQ
An average can hide important variation. A chart can reveal a pattern—or make it easy to miss one. Knowing how to describe a dataset is the first step toward making a sound conclusion from it.
This session gives participants a practical foundation in the measures and distributions used to summarize data. Work through range, frequency, histograms, mean, median, mode, standard deviation, normal distributions, and z-scores, with attention to what each result means.
The session at a glance
Format · Live instructor-led webinar or in-person
Focus · Descriptive statistics, data distributions, standard deviation, and z-scores
Learning objectives · Summarize a dataset, interpret its shape and spread, and explain how an observation compares with the group.
Live instruction. Practical data interpretation.
What to expect
- Clear explanations of statistical terms through compact datasets and visual examples.
- Step-by-step discussion of averages, spread, normal distributions, and z-scores.
- Opportunities to compare interpretations and explain what a result means in plain language.
The goal is to build confidence with the fundamentals while keeping the data, assumptions, and interpretation connected.


Who this is for
- Finance, accounting, and business professionals who work with numerical information
- Analysts who want a firmer foundation for describing data
- Managers interpreting reports and comparing outcomes
- Students beginning quantitative business and finance studies
How to prepare
Comfort with basic arithmetic is enough to begin. You do not need prior statistics training or advanced mathematics.
Come ready to work through small examples and explain your reasoning. Think of a report or dataset you use regularly: what does its average hide, how much do observations vary, and which comparison would be most useful?
Course agenda
Build from the structure of a dataset to the interpretation of a standardized observation.
Organize data using range and frequency.
Identify the limits of a dataset and summarize how often observations occur before choosing a measure or drawing a conclusion.
Use histograms to understand the shape of a distribution.
Read concentration, symmetry, and unusual observations in a histogram, and connect the visual pattern to the underlying data.
Compare mean, median, and mode.
Calculate and interpret the three common measures of center, including how unusual observations can affect each measure.
Explain variation with standard deviation.
Describe how observations differ from the average and explain why spread matters when comparing datasets.
Interpret normal distributions and z-scores.
Explore the normal curve and use a z-score to express an observation’s position relative to the mean in standard-deviation units.
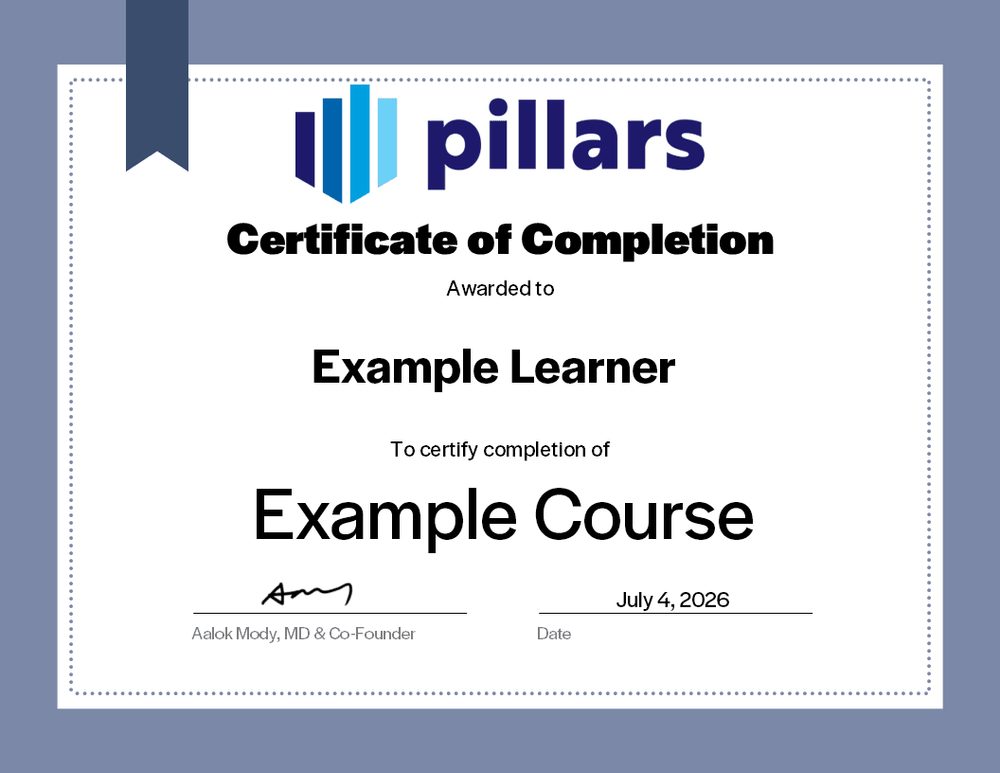
A certificate you can share
Upon completion, you will receive a certificate signifying your completion. Add it to your LinkedIn profile, résumé, or professional-development record.
Common questions
The practical details, in one place.
Is this live or on demand?
This is a live course that may be delivered via webinar or in-person.
What does the session cover?
Range, frequency, histograms, mean, median, mode, standard deviation, normal distributions, and z-scores. The emphasis is on interpreting the result and explaining what it tells you about the data.
Are recordings, materials, or certificates included?
Materials are included with the course as well as a certificate indicating completion. Recording availability is subject to contract.
I am a CPA, can this course offer CPE credit?
Yes! Pillars is licensed to provide CPE credit hours for this course.